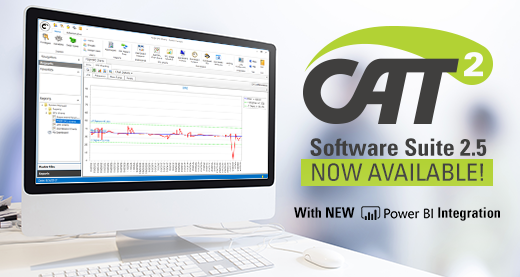
CAT2 Software Suite 2.5 is now available to all CAT Squared customers using our .Net applications (Executive Dashboards, DSD, LIMS). The Software Suite aggregates a number of CAT Squared applications into a single multi-function user interface. The application modules that are included in the first release of the Software Suite include the following:
- System Manager: Manages all system-wide configurations.
- Dashboard Designer: Designs data sets and dashboards.
- Executive Dashboards: Used to view reports, dashboards, SPC charts, data sets, and Power BI dashboards.
- Janitor: Used to create queries for purging old data from systems.
- New! DSD Management: Used to manage all DSD-related settings and to review the daily progress of deliveries
- New! Traceability: Provides customers with whole-plant traceability, allowing recall reports to be generated based on Supplier Lots, Production Lots, or a Point in Time of production. These recall reports consolidate all of the related information for a lot, and can be generated in just a few short minutes.
- New! Device Manager (AKA OPC): Used to gather data and manage a variety of plant floor devices including PLCs and others.
- New! Scenario Designer (Beta): Used to map the processing plant and then develop scenarios to help optimize resources and production. (This is the first beta release of our TacticalOps module, allowing our customers to experiment with building out their plant processes visually.)
New Features
- Power BI Integration: Power BI Dashboards can be added into CAT2 applications including the Executive Dashboards and Scoreboard applications.
- User Definable Tables: Users can now create their own data tables. These tables act in the same manner as our other data tables and they can be used for reporting, dashboards, SPC charts, etc.
- User Definable Data Set Layouts: After creating a user-definable table, a default layout (column order, width, visibility, etc.) can be created and used to view the data.
- SPC Charting Groups: SPC Charting is now fully integrated and can be used with any data set to work with both Executive Dashboards and the Scoreboard.
- Dashboard Import\Export
Scoreboard Updates
- Added support for Power BI Dashboards
- Added support for SPC Charting Groups
- Updated the Moving Range Chart
Please email kathy.barbeire@catsquared.com if you would like a demo of these new features or if you would like to upgrade to the latest version.


