What is an Executive Dashboard?
An Executive Dashboard is a visual representation of a company’s key performance indicators, giving executives a quick overview of their company’s performance metrics in real-time.How do Executive Dashboards Work?
Executive Dashboards connect with ERPs, CRMs, and other notification systems pulling all of a company’s operational data into one place so that managers don’t have to log into multiple systems to generate reports. A well-designed dashboard software will manipulate this data so that the information appears in an accessible format.
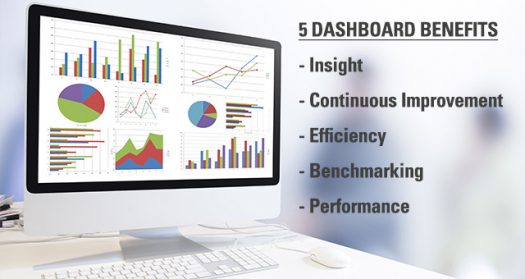
5 Benefits of Installing Executive Dashboards
- Insight: Custom real-time charts, graphs, gauges, and reports can be used to effectively oversee personnel, machinery, and production processes from any network location within an organization.
- Continuous Improvement: According to Peter Drucker, “If you can't measure it, you can't manage it.” With Executive Dashboards, managers can discover and track data trends within one location or across a corporation and know the moment a process reaches a critical state. This knowledge empowers management to make informed decisions.
- Efficiency: Real-time data saves time. Executives save time that used to be spent logging in and out of multiple ERP systems compiling data for reports. The Executive Dashboard is constantly updated with real-time production and inventory data, linking inventory to sales orders.
- Benchmarking Company Performance: With Executive Dashboards, management can easily measure their performance against their goals set in the company’s strategic plan.
- Employee Performance Improvements: A recent project illustrates the impact of CAT Squared’s scoreboards at a poultry manufacturing plant. Because employees were able to see their yields in real-time, management was able to tap into their employees’ competitive nature and offer performance-based incentives, which dramatically improved employee morale and product yield. Our customer saw a complete ROI in less than one year.
Are you interested in seeing how CAT Squared's Dashboard Builder empowers executives to easily build custom dashboards to track their KPIs? You’ll love the way our software tools help you problem solve.


