
In July, CAT Squared released an update to their SPC software that empowers plant-floor operators with real-time SPC trending data and charts. Production staff can now make adjustments to their plant-floor processes and immediately see how those adjustments impact the quality of the product.
"Our system always included SPC capabilities," explained CAT Squared CEO Vernon Smith. "What makes this new functionality different is that our system now provides real-time SPC Charts and data using stored datasets. This eliminates users having to reload or drill into data every time they want to see SPC trends. This also enables us to display SPC charts in real-time on the plant floor using scoreboards."
Why is process control important?
Humans crave consistency and predictability. The secret to any premium product’s success is the delivery of a consistent product at any location every time. Customers know, for the most part, that a Big Mac from Jackson, Mississippi is going to have the same flavor, consistency, and dimensions as a Big Mac from Jackson Hole, Wyoming. Likewise, manufacturers know their customers expect a specific experience from their brand every time. The goal of any mass manufacturing process is to achieve this level of consistency. This is where SPC can help.
What is SPC?
SPC (Statistical Process Control) is a method of quality control that employs statistical methods to monitor and control a process.
How is SPC used in food manufacturing processes?
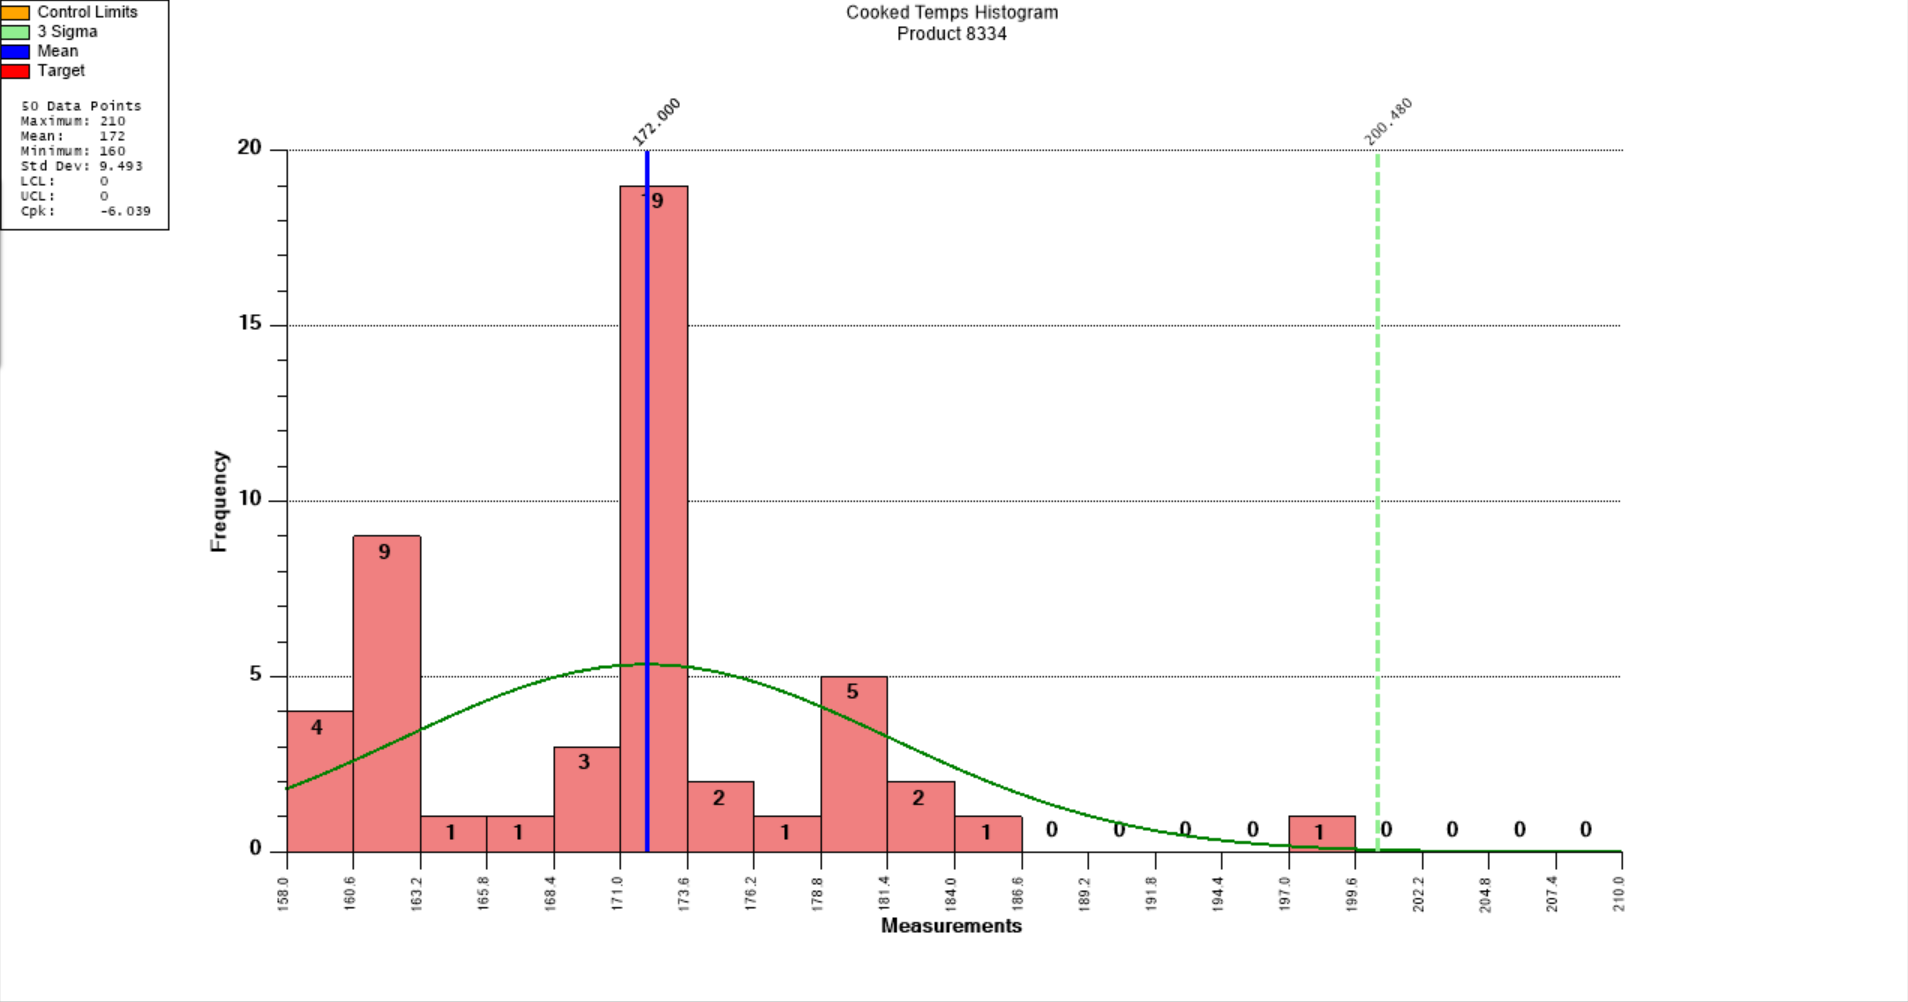
SPC charts can be used as a tool to control any process or product attribute: piece weights, cook temperatures, length, width, thickness, etc. The chart below shows a product’s cook temperature. The technician on the floor is required to perform checks with a temperature probe on 5 pieces per minute. Each plot on the chart represents the average temperature for each of those 5 temps. While the system validates that the product remains within your predetermined spec limits, such as 168 for a low to prevent undercooking and 185 for a high to prevent moisture loss, the SPC charting tool calculates the LCL (Lower Control Limit), or LSL (Lower Specification Limit), which is 156.84 degrees for this set of data. The calculated UCL (Upper Control Limit), or USL (Upper Specification Limit), is 182.36. While any product that fails the product’s spec limit will generate a corrective action form to be completed, statistical deviations above the UCL or below the LCL will be marked with a red (UCL) or blue (LCL) visual indicator on the SPC graph.

In addition to alarming on deviations above the UCL or LCL for xBar or rBar run charts, the system will also alert for deviations based on the sub-set variances. As you can see from the top chart, all of our sub-set average data points fall along the X-bar. At first glance, many manufacturers would look at that graph and think their process is in control. However, when you look at the lower chart that shows the variance, you can see that the process is out of control based on the 3-Sigma calculated variance UCL and LCL. A perfect variance would be zero, meaning that your process is delivering perfectly consistent results every time. On this chart, the final plot point is nearly off the chart. So, the internal temperature of the product being checked is varying widely between the upper and lower limits. This problem would not be detected if only looking at the top chart. Even before the final sub-set, the graph was showing a process with a Standard Deviation of 9 degrees, flagging the process as out of control.
In addition, the graphs can include a large number of statistically generated values based on your sub-sets, including the Cp, Cpl, Cpu, Cpk, Cpm, etc. With real-time access to this level of data, the operator can detect and address production issues immediately. In this example, employees can investigate whether there is an equipment issue with the oven or the probe, or perhaps a process further up the line is producing inconsistent thickness leading to varying cook temperatures.
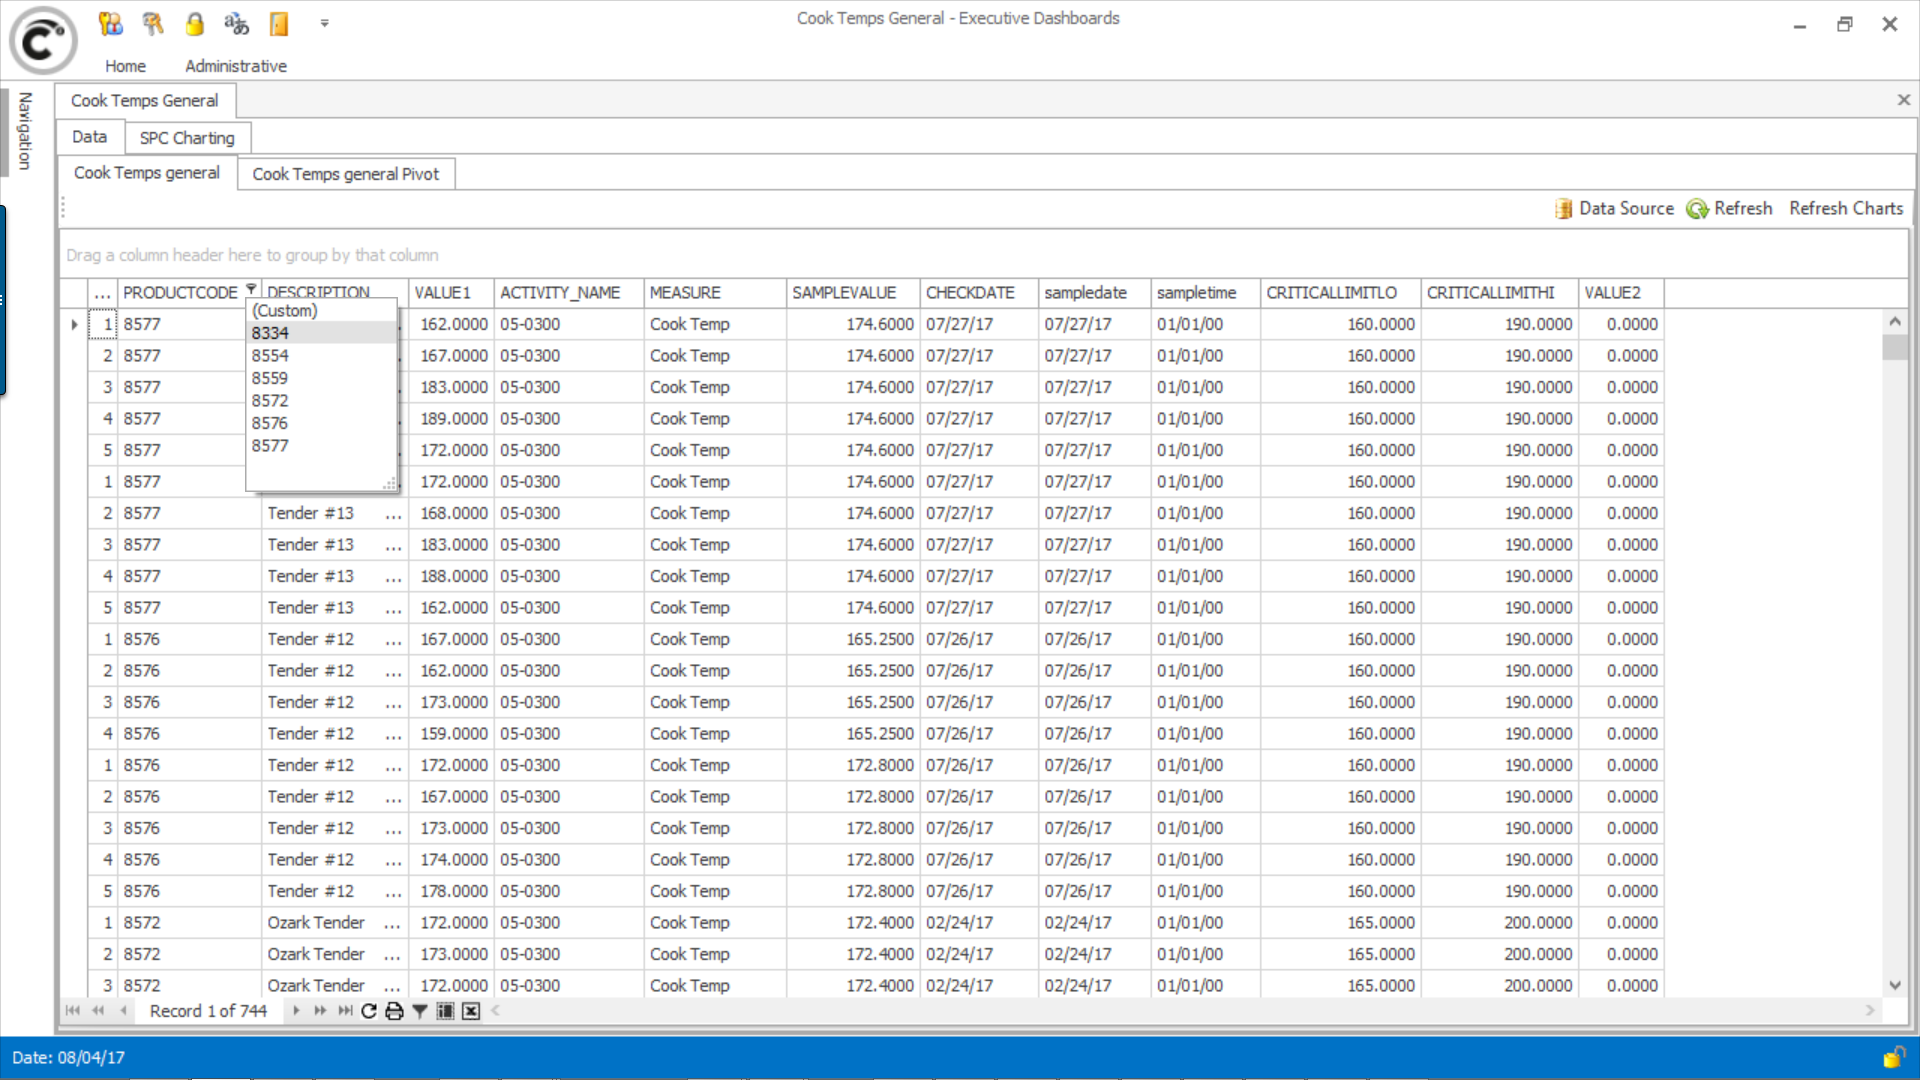
In addition to real-time data on the floor, the new features also allow for data mining based on your data sets. Users can easily filter and sort data and generate new graphs using the user-friendly Executive Dashboarding interface.